K-12 Analytics
- Providing teachers and administrators with a clear picture of student performance at an individual or group level so they can adjust instruction to improve student and teacher performance
- Quickly and easily generating the assessment reports they need for their school board and local, state, and federal requirements, such as No Child Left behind (NCLB)
- Implementing systems that contain longitudinal data and provide assessment reports to support Department of Education reform initiatives such as Race to the Top
- Gaining a better understanding of projected revenues and expenditures, keeping track of the school district's financial health, comparing costs for services (e.g. transportation) to other districts, and maximizing the amount of resources that make it to the classroom
- Improving response to legislative and grant requests and showing compliance with the reporting requirements
- Identifying high and low performing programs to determine where to direct funds
- Ensuring schools continue to provide a safe and secure teaching and learning environment.
However, one of the biggest challenges they face is that the data required to provide information for such initiatives is locked away in silo'ed systems. Any analytics information often is only available to a few people. Hence IT organizations and administrators are forced to create such reports manually – a resource-intensive and error-prone process.
Phytorion combines its knowledge of the K-12 education market and its expertise in data warehousing and analytics, to deploy data warehouse systems that meet these requirements in a very cost-effective manner. Phytorion enables K-12 districts to own a user-friendly data warehouse and reporting system that helps in assessing performance, individualizing instruction, complying with regulations and funding the programs that deliver the best performance.
- Reporting on benchmark data and state test data at the individual strand level, including distractor data
- Analysis of state test score data and benchmark data
- Analysis of correlations between grades and state test or benchmark test scores
- Correlation between participation in math and reading labs and the corresponding test scores
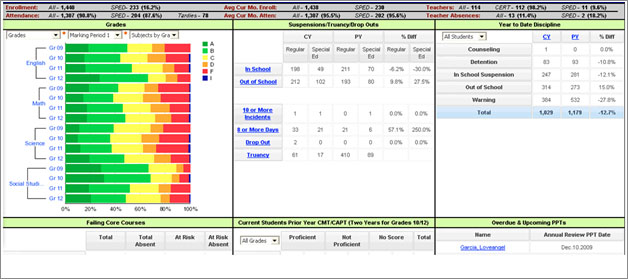
- Correlation between performance (grades and test scores) and discipline events
- Discipline reporting – daily suspension (in-house and out), interventions
- Report on students failing particular classes, along with corresponding state test scores
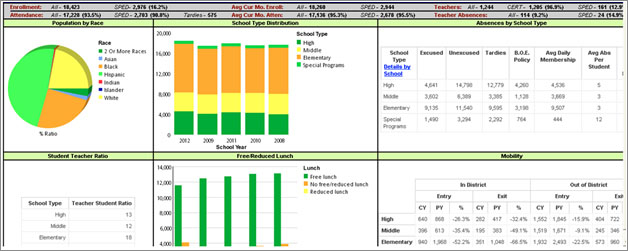
- Report of daily enrollment and attendance numbers
- Report on teacher absences
- Vertical transition reporting
- Counts of students in various Special Ed stages
Such insights will facilitate a new culture that empowers educators and administrators by providing them the data to: make informed decisions that maximize student learning and achievement, and teacher development and enrichment; track the workforce; and meet state and federal regulatory reporting requirements.
SAMPLE BI OBJECTS


